


TL;DR
- Pump.fun lost its top spot in the memecoin launchpad sector to rising competitors like LetsBonk.fun, whose market share exploded from 13% to 78% in July 2025.
- Pump.fun has been regaining market share as rivals’ growth slows, but investor confidence remains low.
- PUMP launched at a $4B FDV with 43% supply unlocked, creating heavy sell pressure—similar to JUP’s post-launch struggles despite bullish market conditions.
- PUMP’s delayed unlock schedule could reduce future supply shocks compared to peers like JUP, which faced faster emissions.
- PUMP is deploying 100%+ of its revenue into buybacks, currently a higher rate relative to market cap/FDV than HYPE, helping drive recent momentum.
- Future dominance hinges on feature rollouts, clarity on airdrop allocations, sustaining buybacks, and navigating a highly competitive market cycle.
Pump.fun was once the top memecoin launchpad, but its lead faded as rivals took over. Recently, it’s started to win back market share. The question now is—can this recovery last, or is it just a short-term bounce?
This report dives into PUMP’s tokenomics, emissions, and value drivers—highlighting both the opportunities and risks that investors should keep in mind:
- Rising Competition - intensifying competition among launchpad sector
- Tokenomics Overview - Current supply dynamics and distribution structure
- TGE Valuation and Market Response - TGE analysis and price performance afterwards
- The Token Buyback War - key factors that revive momentum of PUMP
Rising Competition
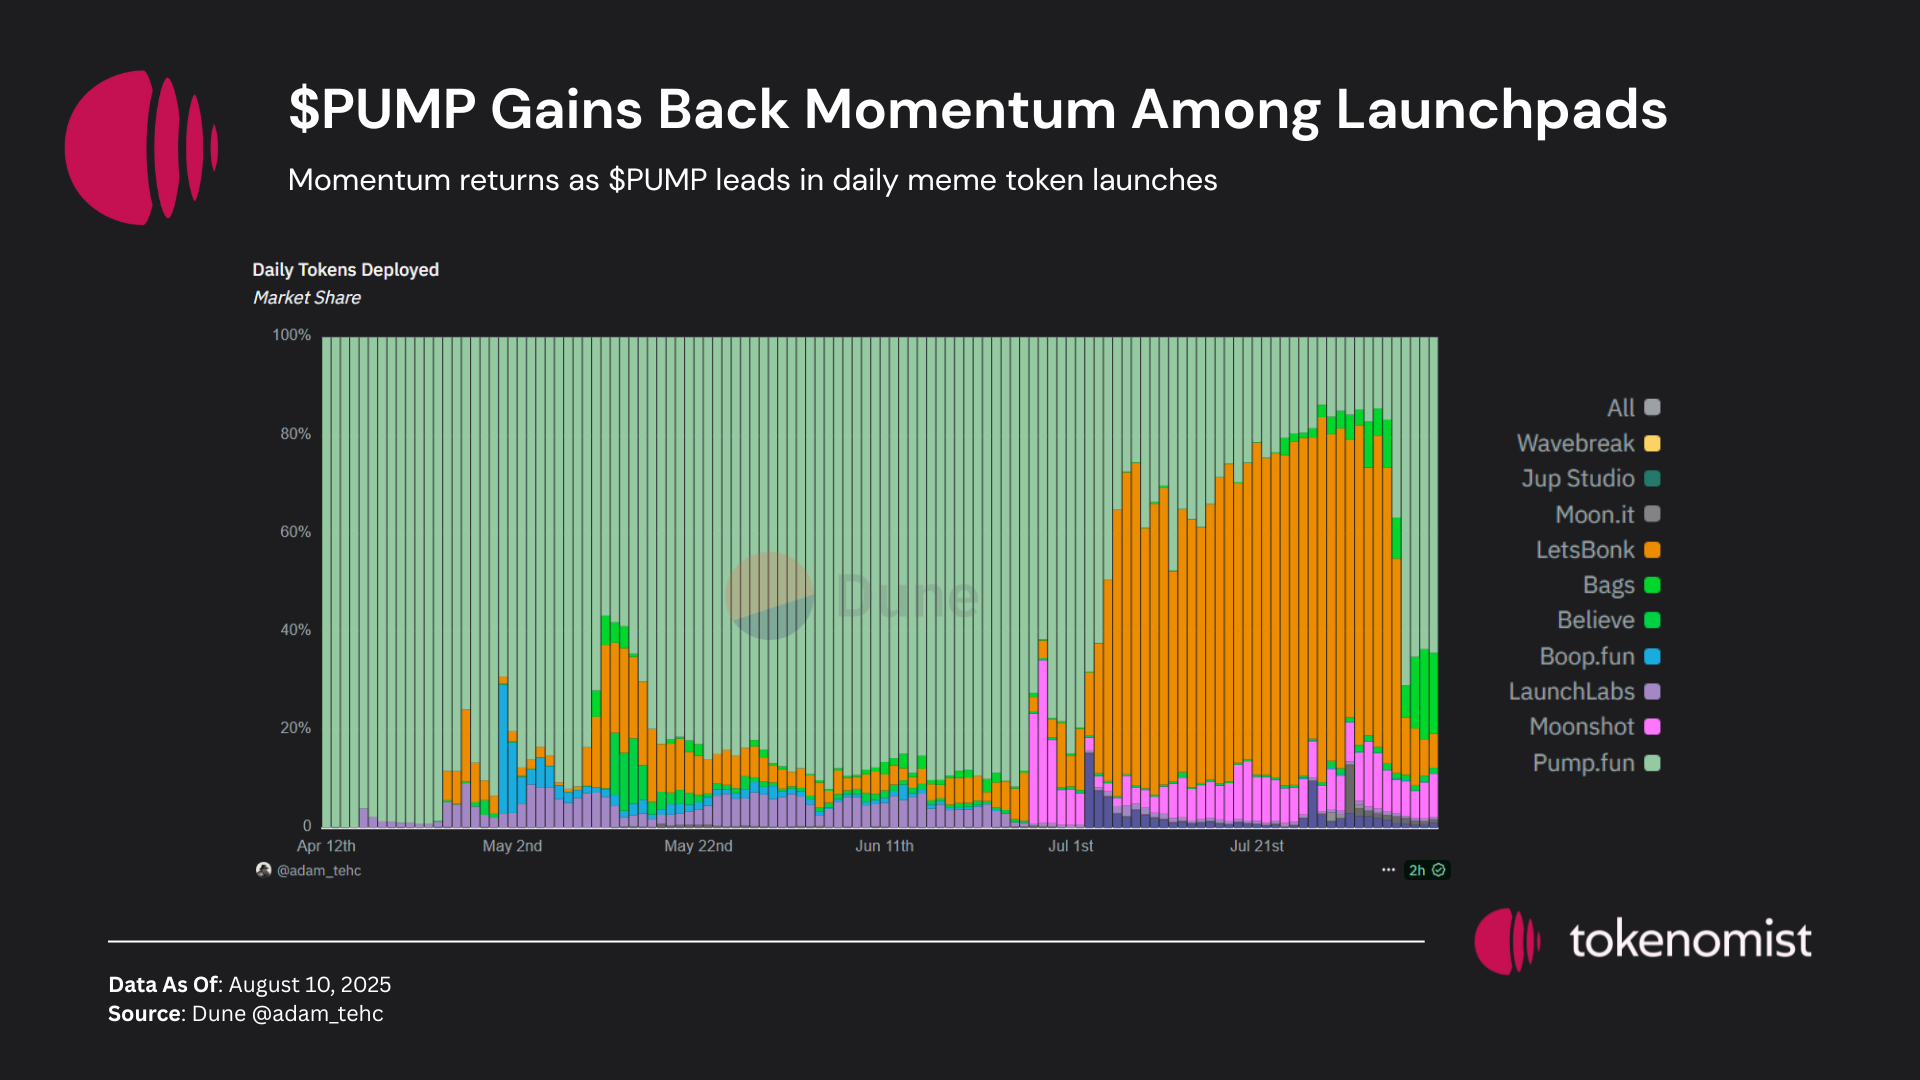
Key driver behind PUMP’s weak price performance has been intensifying competition. Pump.fun once held a dominant position among memecoin launchpads. However, its attempt to expand vertically with the launch of Pump.swap was quickly countered—most notably by Raydium’s introduction of LaunchLab. This opened the door for a wave of new competitors offering more attractive features, which steadily eroded Pump.fun’s market share.
The most striking opponent came in July 2025, when LetsBonk.fun’s share of daily token launches on Solana surged from 13% to 78% in just one month. This rapid rise sparked concerns over whether Pump.fun could maintain leadership—especially after the platform’s token launch, which added pressure to deliver strong fundamentals.
Even though Pump.fun has shown signs of regaining momentum lately, the market share it previously lost continues to weigh on market confidence.
Pump -> Bonk
— Crypto Koryo (@CryptoKoryo) July 22, 2025
GMX -> Hyperliquid
BAYC -> Pudgy Penguins
Polygon -> Arbitrum
Fetch -> Tao
Compound -> Aave
FTX -> Coinbase
Pepe -> Fartcoin
The short history of crypto is full of such rotations.
Nothing lasts forever.
The project having the highest market share in its sector…
From a historical perspective, the crypto market often witnesses rapid rotations in dominance: projects at the top can quickly be overtaken by challengers with better timing, features, or marketing. LetsBonk.fun exemplifies this trend. Its competitive edge stems from:
- A bonding curve that gradually increases token prices
- Anti-bot and anti-sniping mechanisms to ensure fair launches
- Automatic governance creation for graduated tokens
- A commitment to use 1% of revenue for buybacks and burns of top token pairs on the platform
While Pump.fun could integrate similar features in the future, features alone do not guarantee user retention or market share recovery. In crypto, branding, execution speed, and the ability to capture user attention are often decisive factors.
Interestingly, recent metrics show that LetsBonk.fun’s number of daily token launches and revenue have started to decline, while Pump.fun has begun regaining momentum. Whether this marks the start of a sustained comeback or just a temporary rebound remains uncertain, but it underscores the fluid and highly competitive nature of the meme launchpad sector.
Let’s deep dive into the key factors that are shaping Pump.fun’s competitive position.
Tokenomics Overview
- Total Supply: 1 Trillion
- Circulating Supply: 430 Billion (43% of total supply)
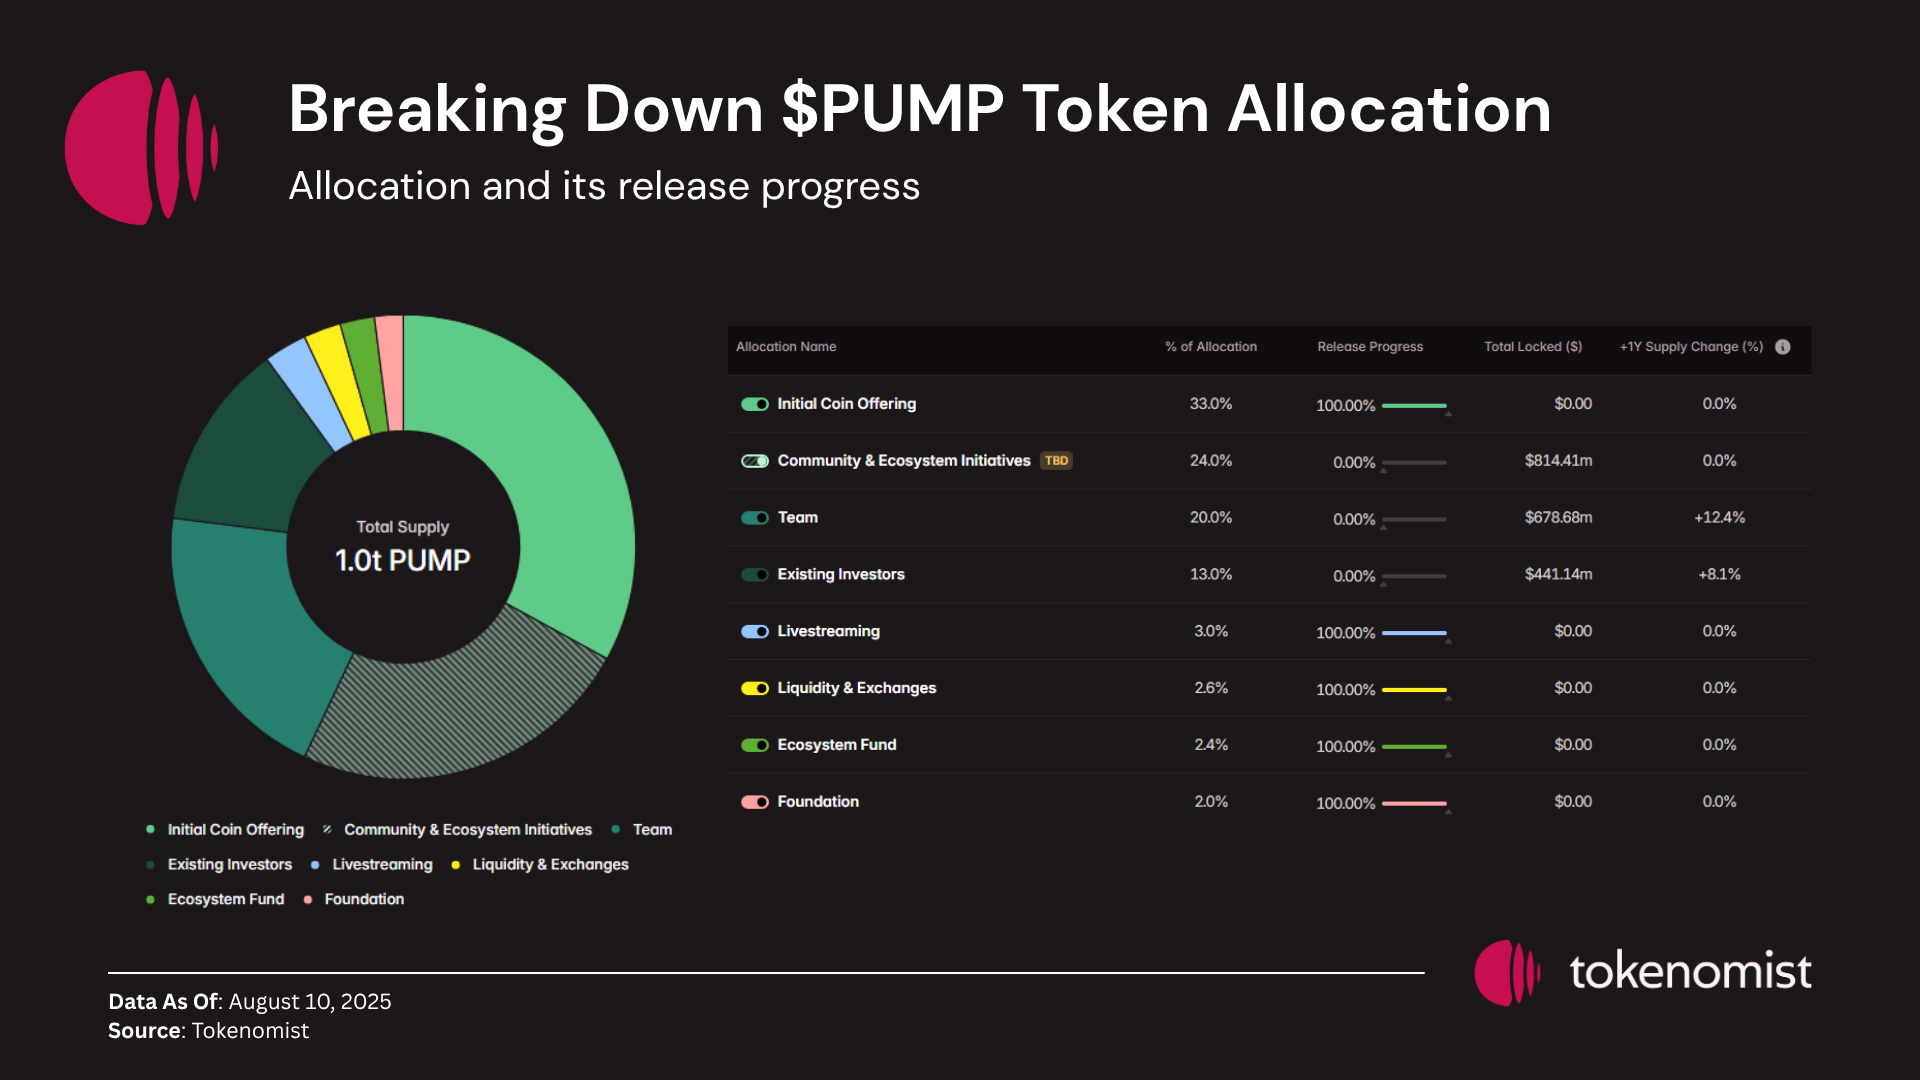
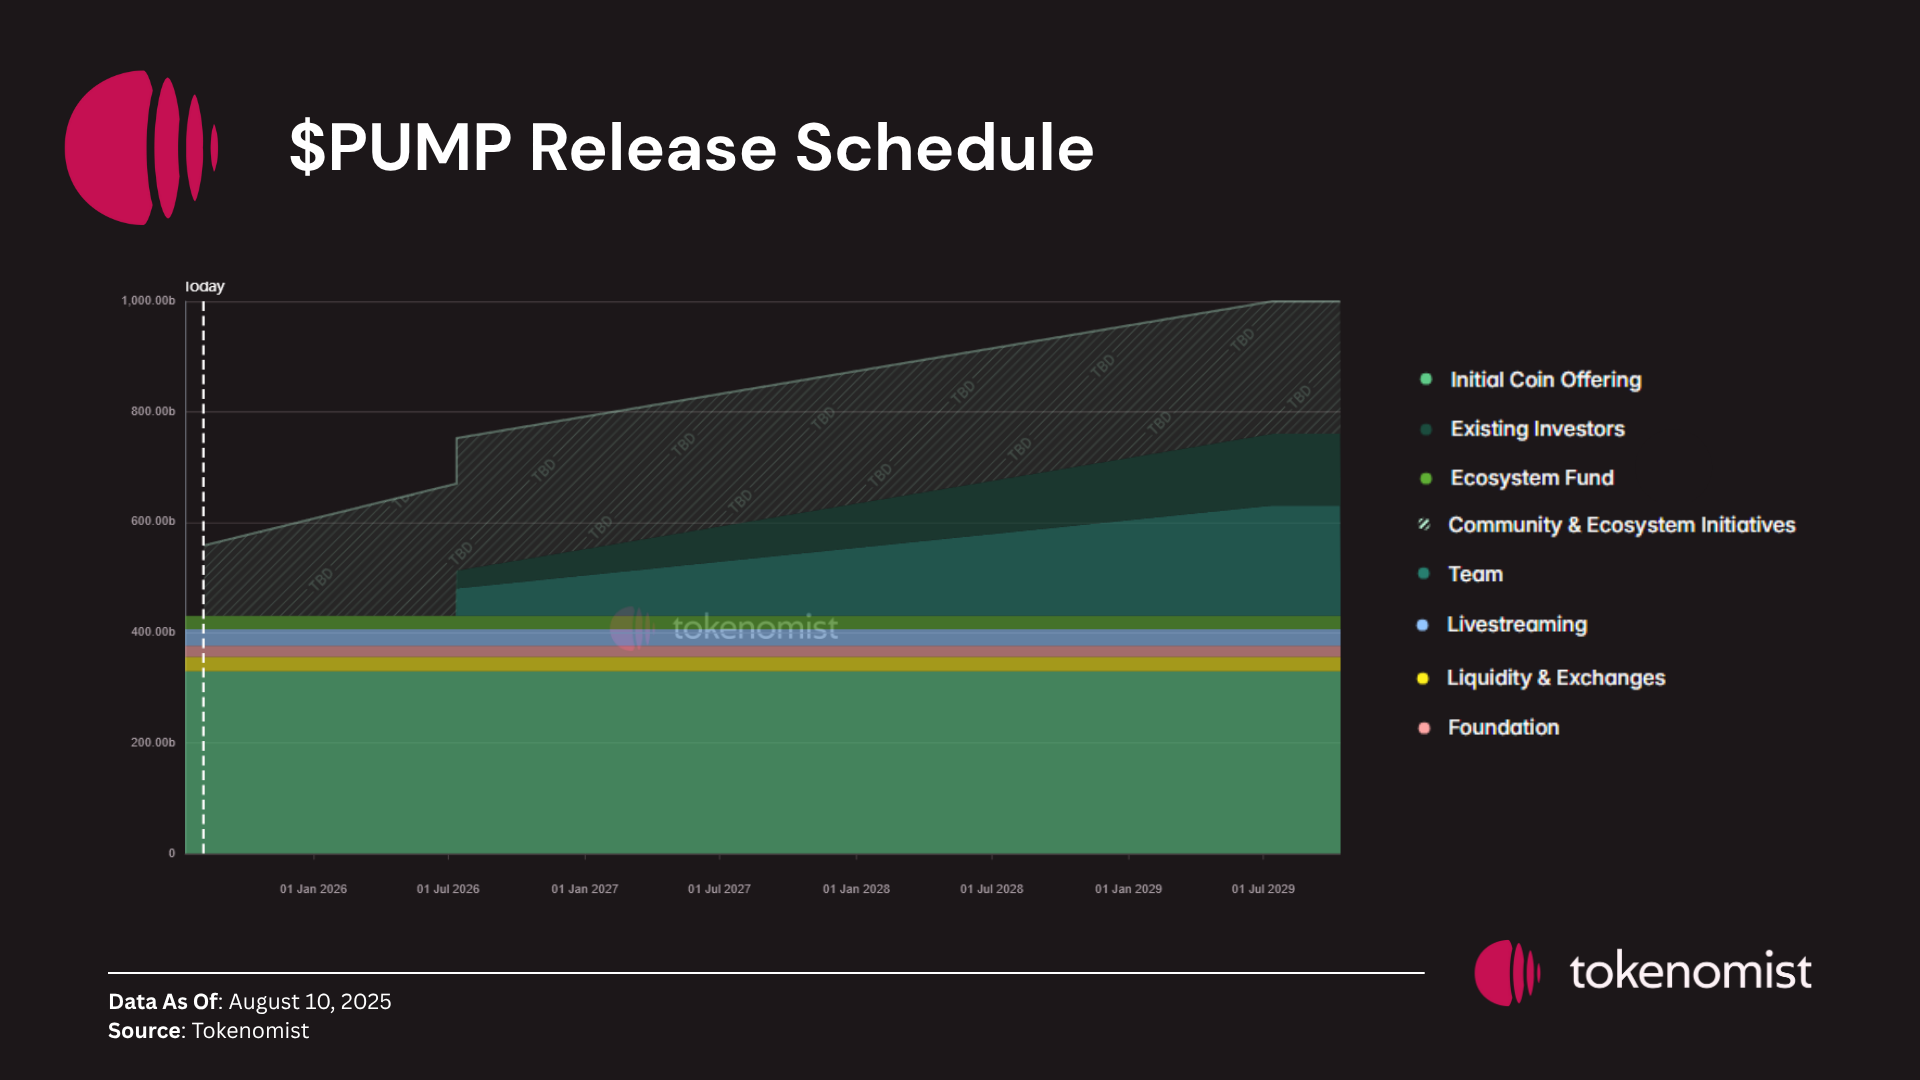
The current token release progress for PUMP stands at 43%. Remaining locked tokens include:
- 13% allocated to existing investors and 20% to the team, with an initial 25% unlock scheduled for July 2026, followed by linear vesting over the subsequent three years.
- 24% reserved for community and ecosystem initiatives, though the specific airdrop details are yet to be announced.
TGE Valuation and Market Response
An intriguing aspect of PUMP’s tokenomics is the sizable 33% allocation for the ICO, conducted on July 12, 2025. This funding round raised approximately $1.3 billion at a $4 billion FDV valuation, marking it as the third largest ICO in crypto history. The ICO allocation was split between private investors (18% of total supply, ~$720 million) and a public sale (15%, ~$600 million). Notably, the public sale sold out in just 12 minutes, with only slightly more than half of KYC-approved wallets able to participate, underscoring the exceptionally high demand.
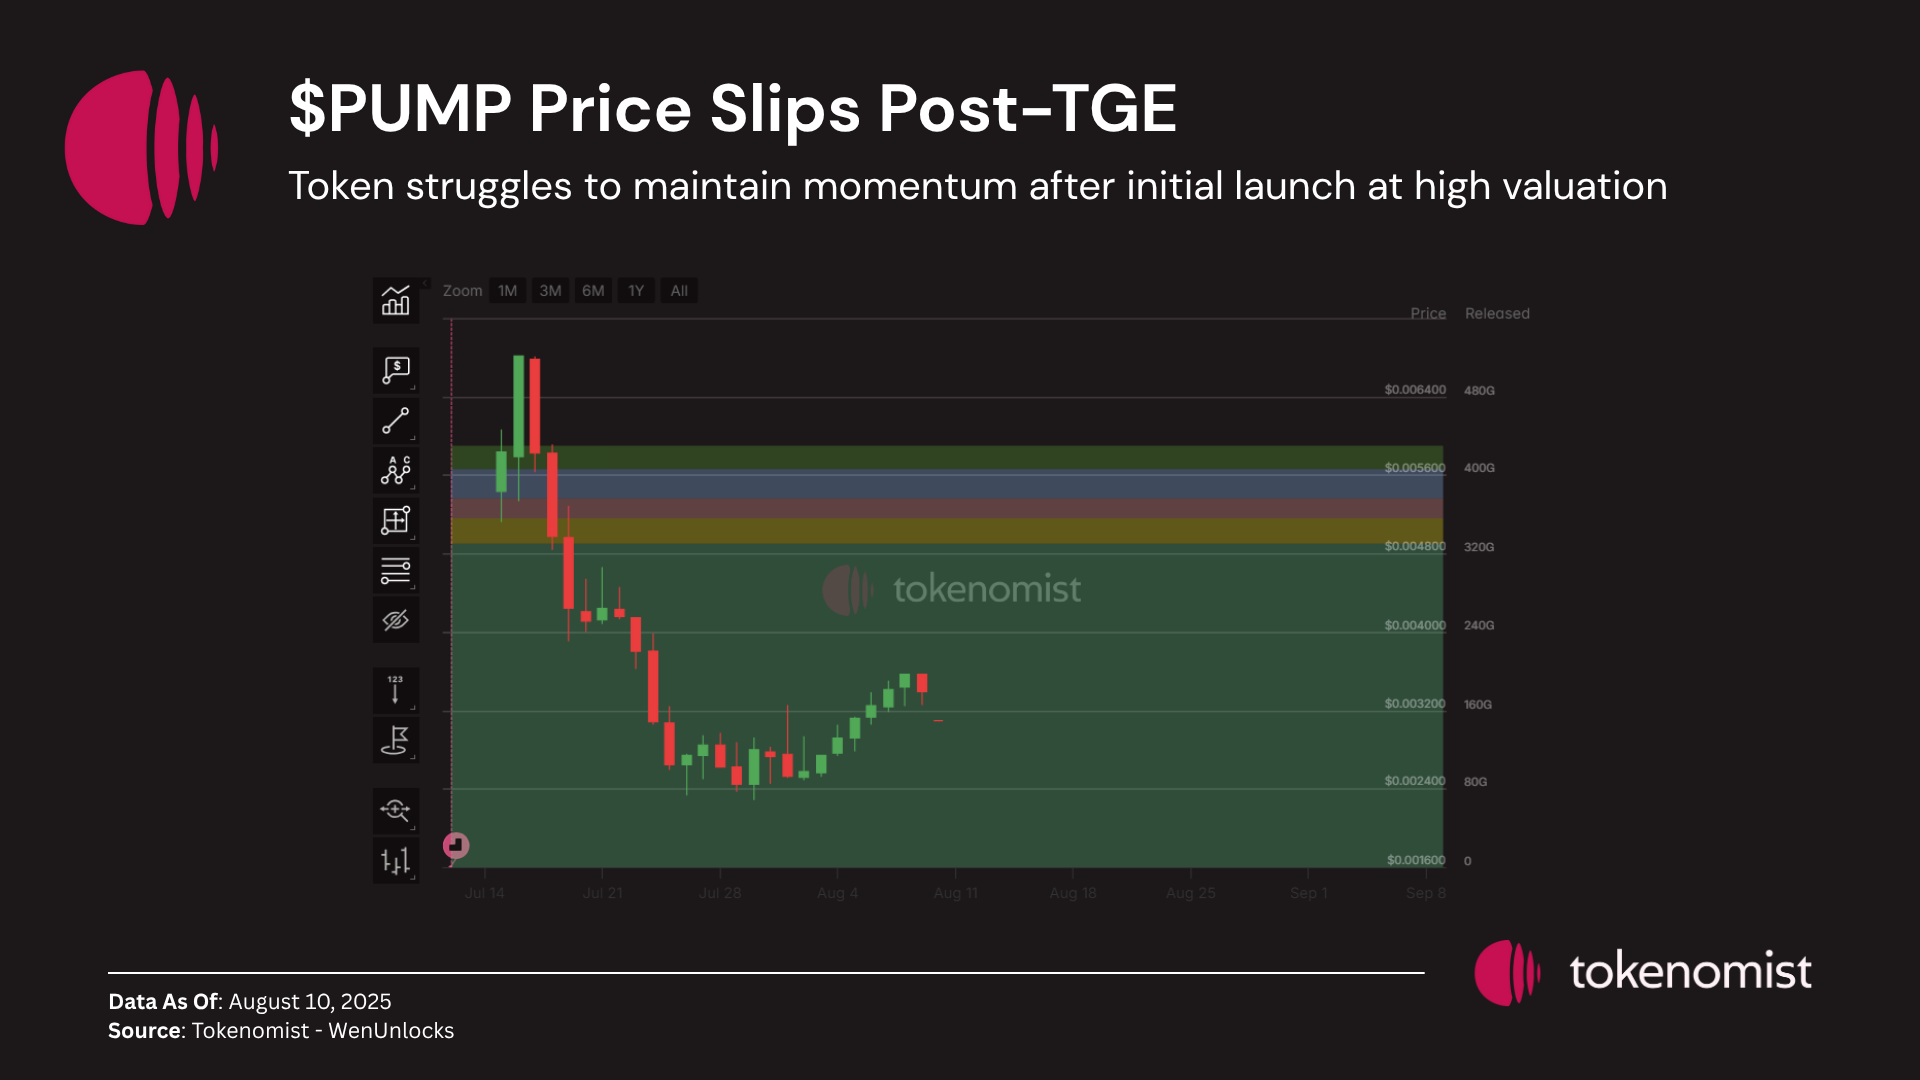
Even with high demand, many see the PUMP ICO as a “max extraction” because it launched at a very high price. Adding to concerns, unclear plans for community rewards—like airdrops mentioned by Alon—have hurt confidence. Since hitting its peak price of $0.0067 after the ICO, the token has dropped to $0.0023.
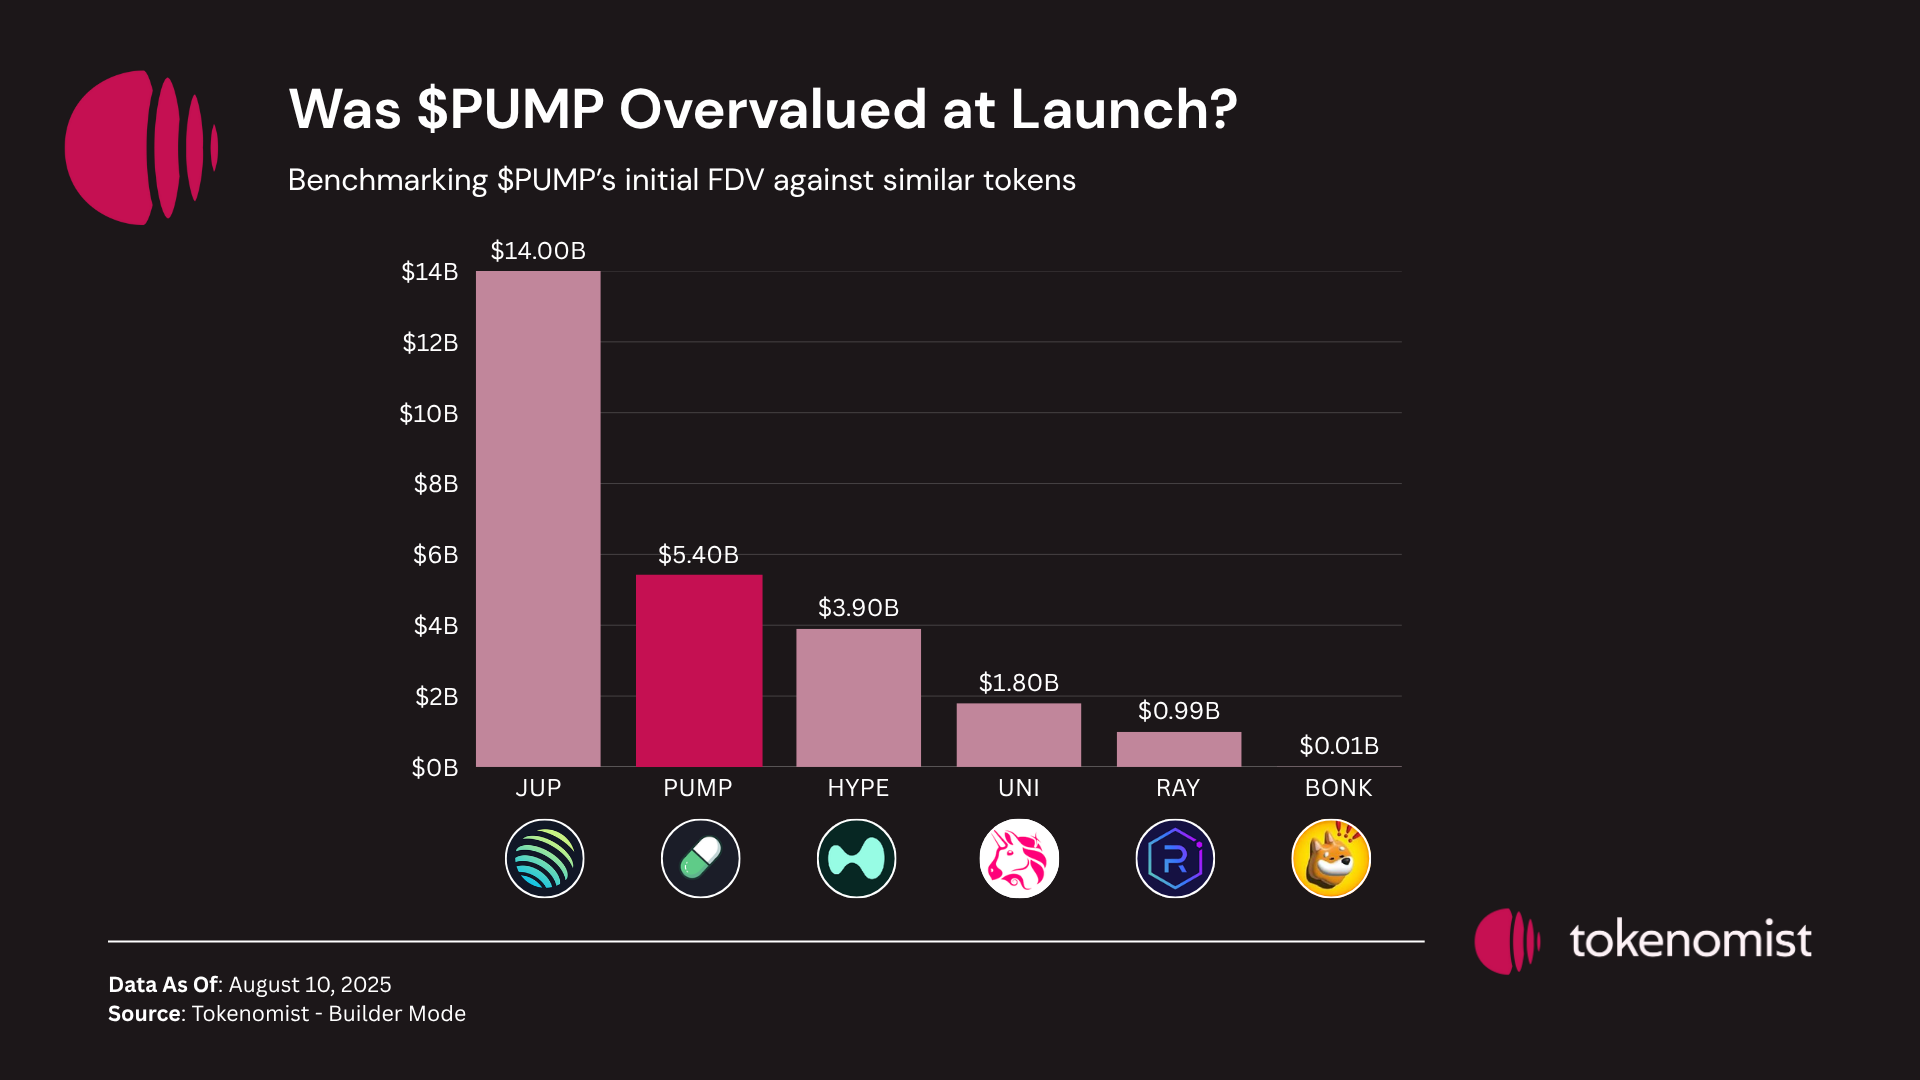
To evaluate whether PUMP’s ICO represents a max extraction, we compare it against a set of competitors spanning memecoins, launchpads, and DEX tokens:
- Direct competitors: LetsBonk.fun (BONK), LaunchLab (RAY)
- Indirect competitors: HYPE, JUP, UNI
Among the selected peers, PUMP launched with the second highest TGE valuation at $5.4 billion, surpassed only by JUP (Jupiter). This high valuation placed significant pressure on PUMP’s price performance from the outset. In contrast, tokens like HYPE started with a considerably lower initial valuation, which allowed for a more sustainable and organic price appreciation post-TGE. HYPE’s gradual approach helped foster community trust and wealth accumulation, resulting in stronger and steadier market performance.
JUP’s own experience reinforces this point. Despite launching during a bullish market environment with strong hype, its elevated TGE valuation became a major headwind, leading to notable price declines after launch. This pattern illustrates a broader market tendency where even in favorable conditions, tokens that debut with overly optimistic valuations often face rapid corrections as investors adjust expectations and early sellers capitalize on peak prices.
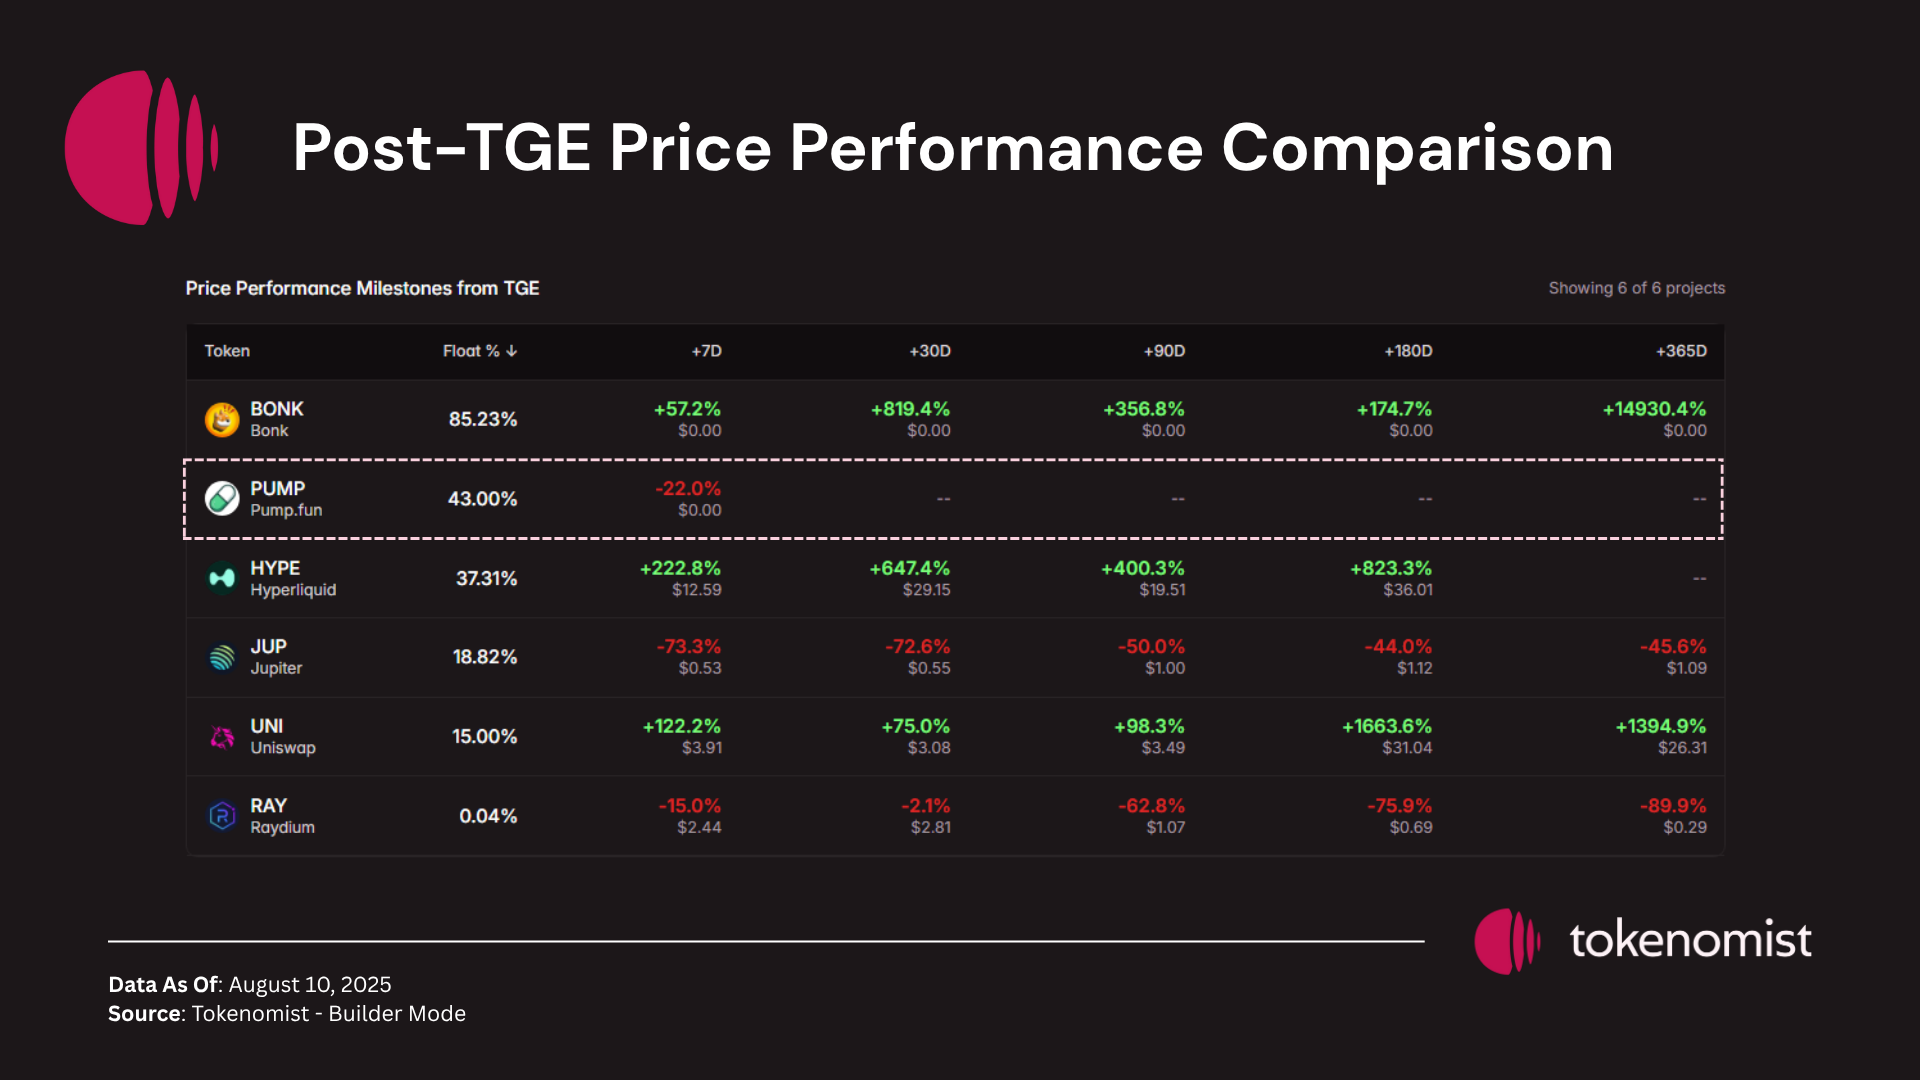
However, a key differentiating factor between PUMP and JUP lies in their emission schedules. PUMP’s design delays its first token unlock until over a year after the TGE, creating a controlled and predictable supply increase. In contrast, JUP’s higher emission rate, driven by a low initial circulating supply, has flooded the market with new tokens earlier, increasing selling pressure and accelerating price declines. By adopting a more conservative and gradual unlocking mechanism, PUMP potentially reduces the risk of sharp future price drops caused by sudden supply shocks.
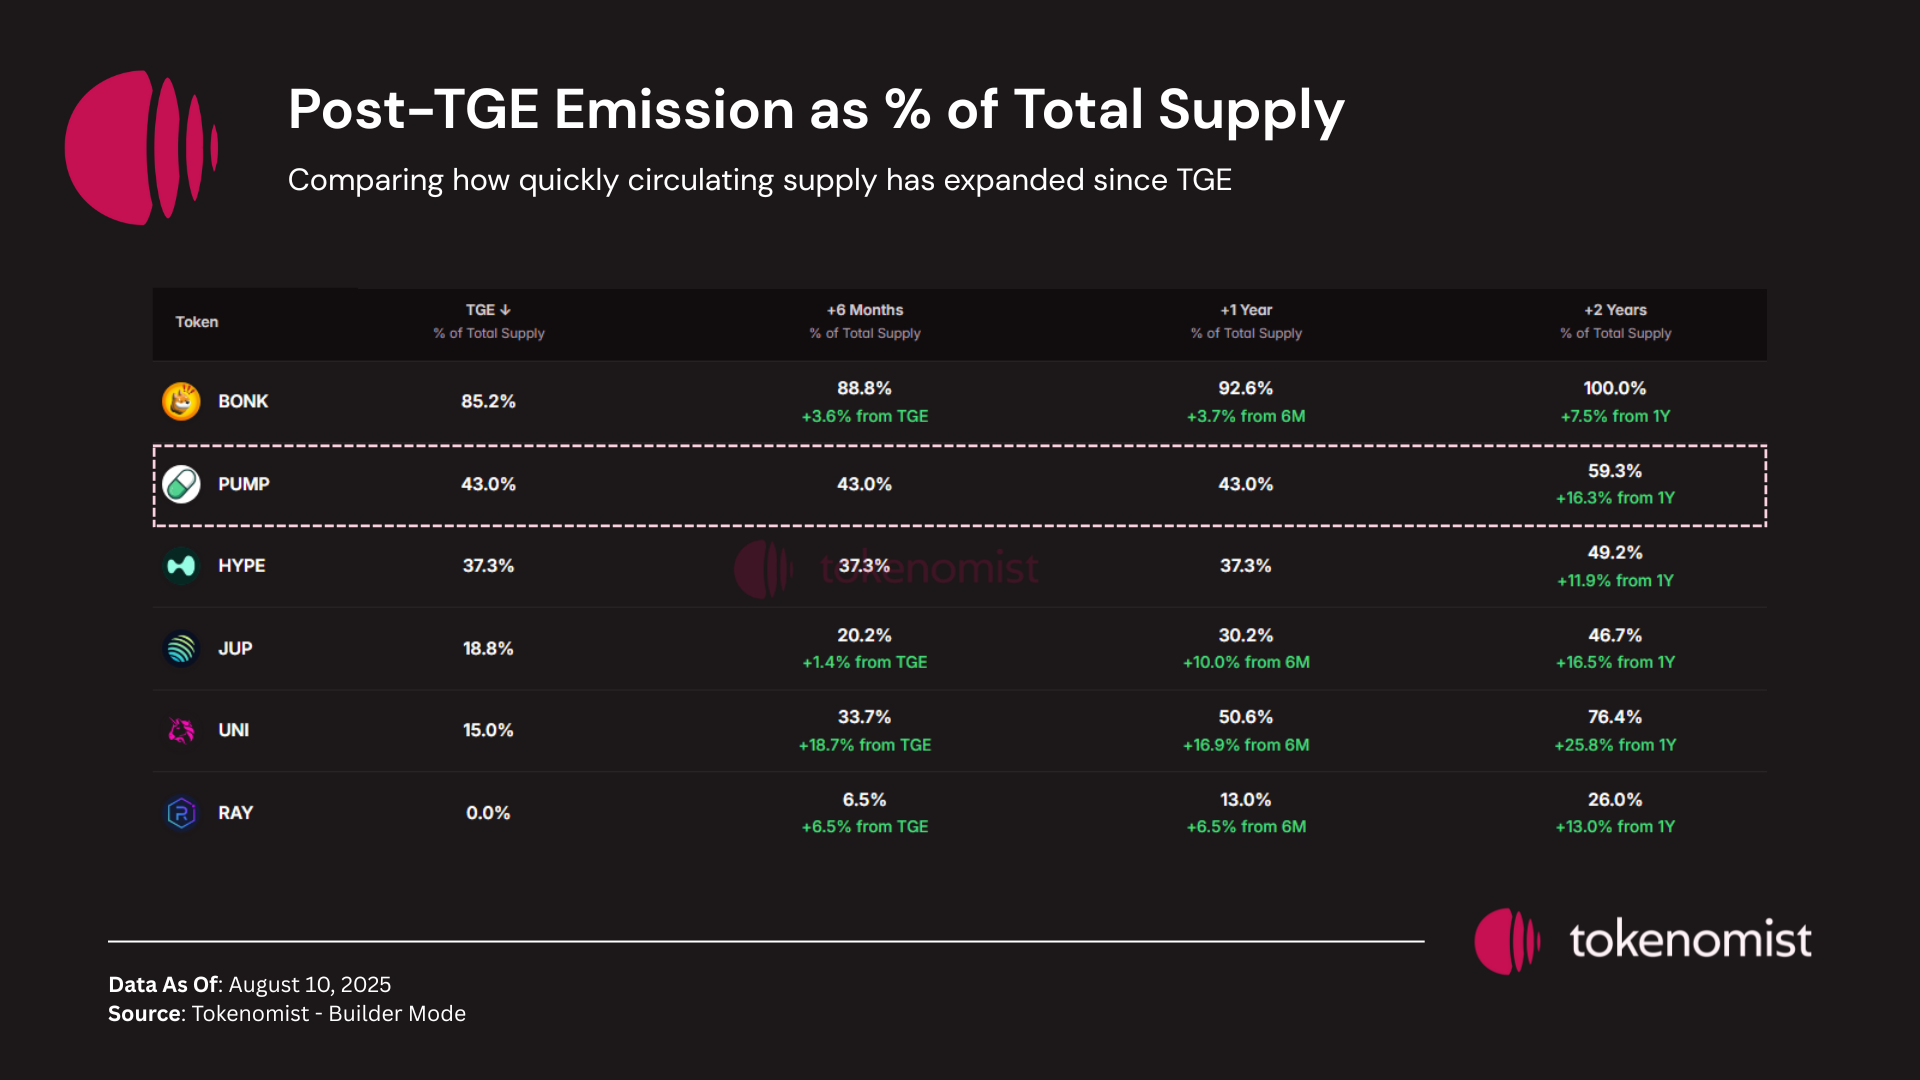
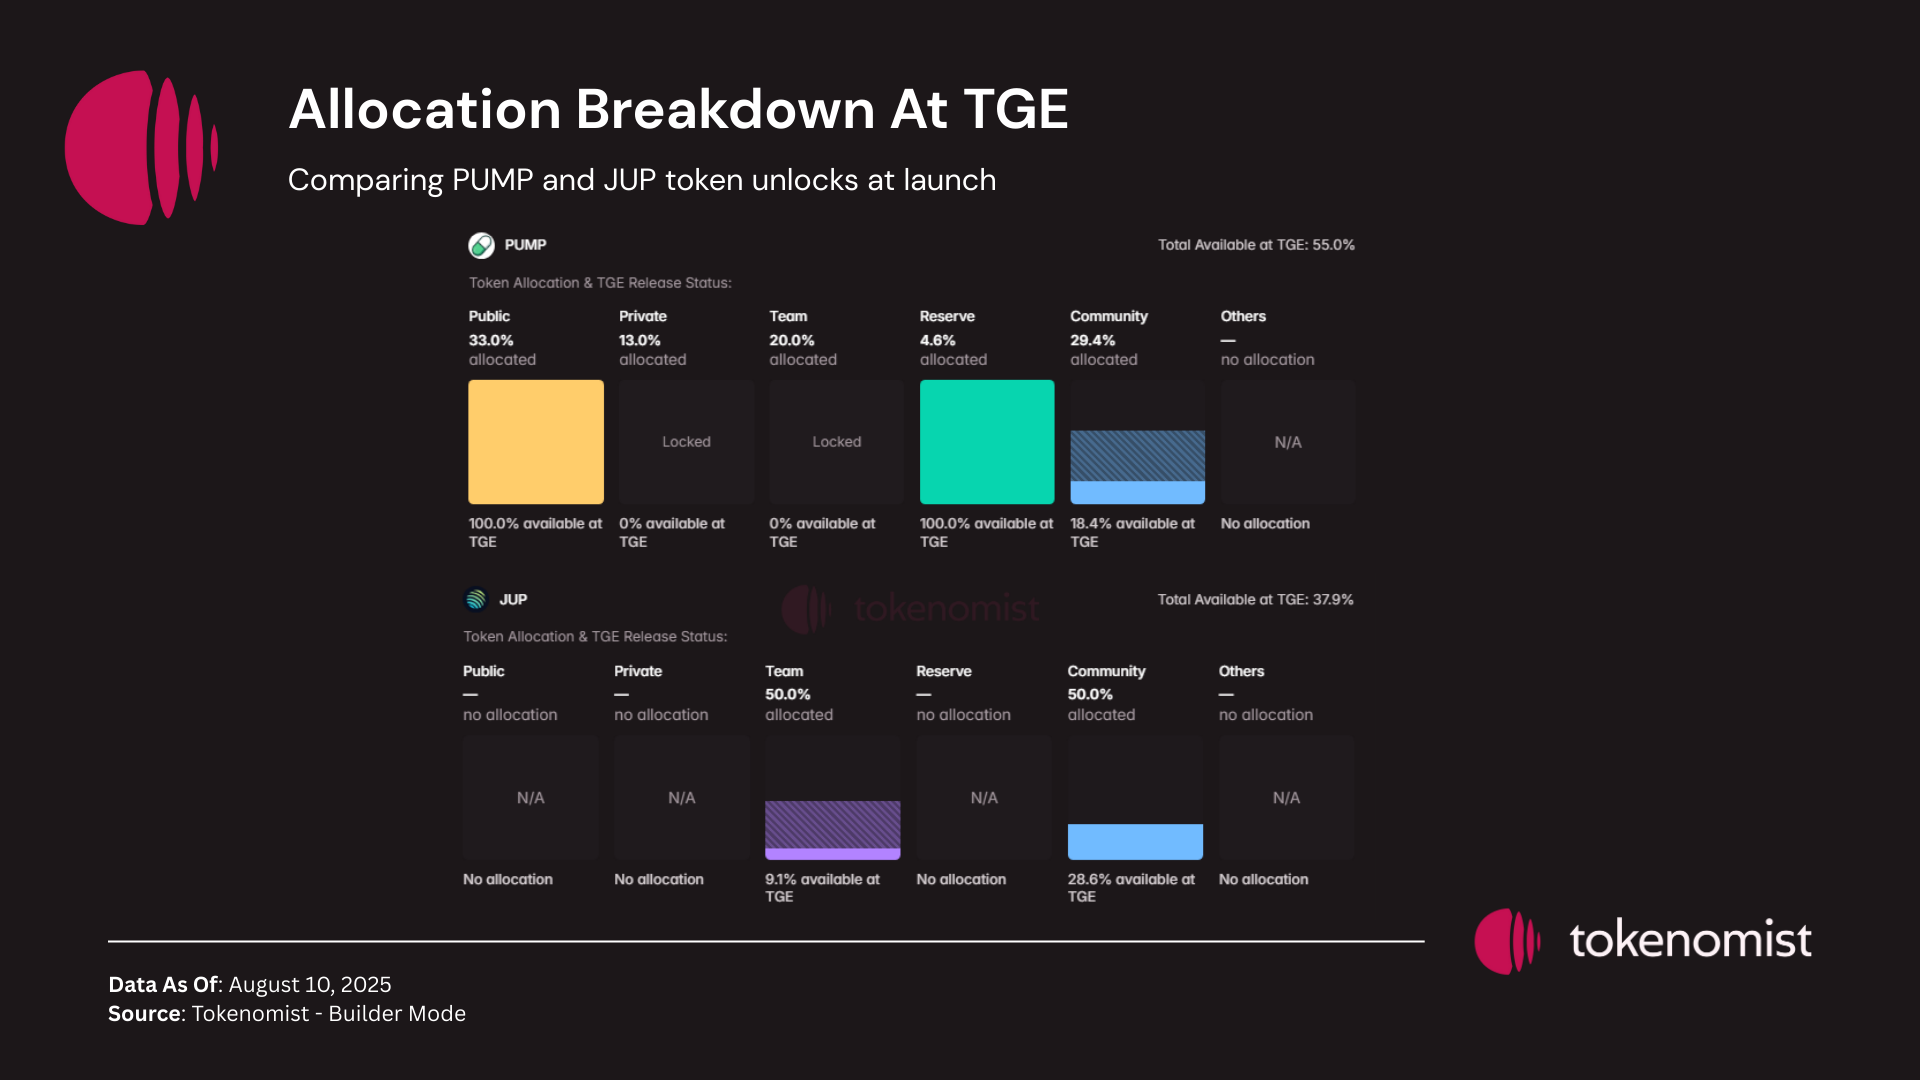
Adding to the comparison, most selected tokens typically unlock only two standard allocations at TGE — Community and Reserve. In contrast, these two tokens had additional categories unlocked.
- PUMP allocated 33% of total supply to public investors at TGE
- JUP allocated 9.1% of total supply to team at TGE
These extra unlocks likely contributed to additional sell pressure, whether from insiders exiting or public investors taking profits.
The Token Buyback War
One of the key drivers behind PUMP’s recent momentum is its adoption of a token buyback strategy using protocol revenue, a trend that has become a popular meta across the market for creating deflationary pressure. Several projects, including those in the memecoin launchpad sector, have embraced this approach.
- LetsBonk.fun allocates 50% of its revenue in SOL to buy back and burn BONK, having already removed over 150k SOL worth from circulation—equivalent to roughly 1.35% of its circulating supply (source)
- Similarly, Pump.fun began applying this strategy post-token launch, directing all net revenue toward buybacks. As of now, total buybacks amount to around 178k SOL, representing approximately 2.39% of circulating supply (source)
PUMP’s recent market optimism is fueled by signs that the platform has been spending over 100% of its revenue on token buybacks in recent weeks. According to Token Terminal, Pump.fun generated $420M in revenue over the past year — surpassing Solana’s $390M in the same period.
Let’s compare PUMP’s buyback strategy to HYPE (Hyperliquid), a token widely recognized for its aggressive buybacks.
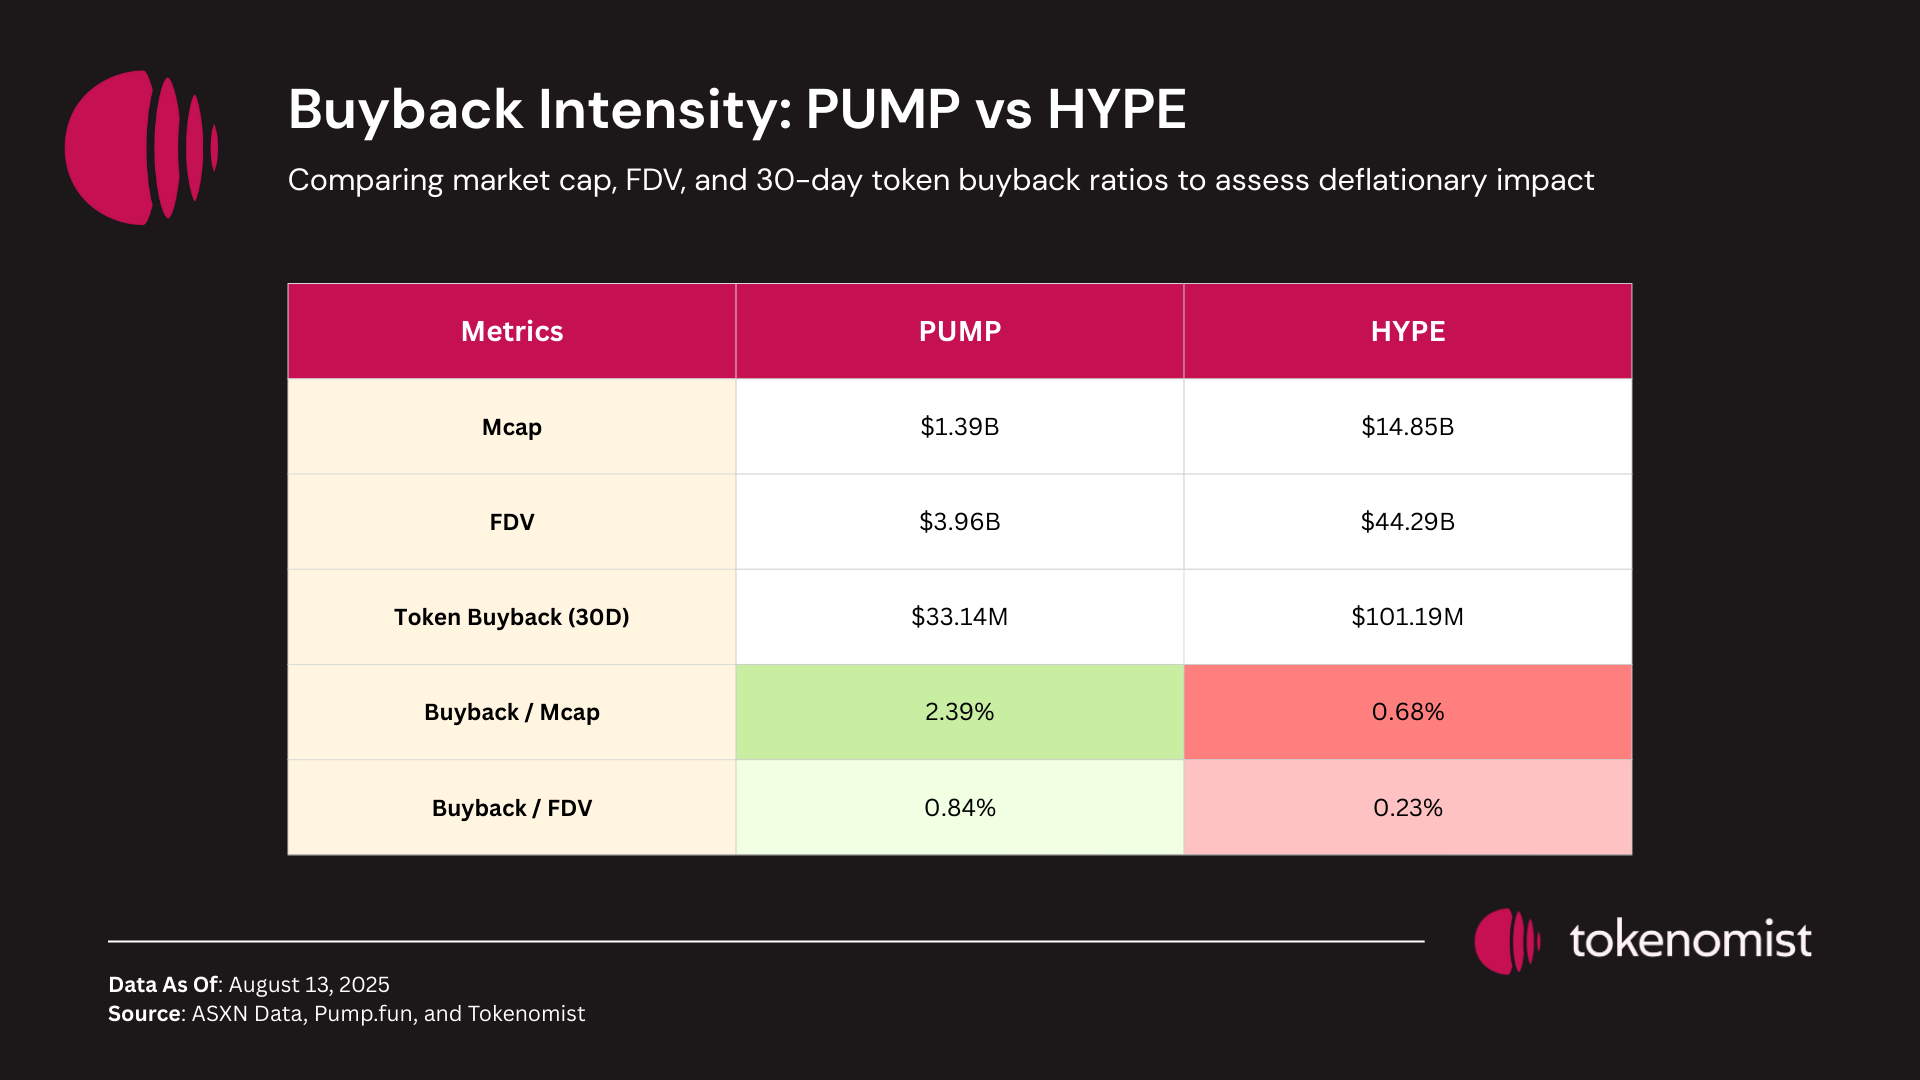
When measured against both market cap and FDV, PUMP’s current buyback rate is significantly higher than HYPE’s. While HYPE has a market cap more than 10× higher than PUMP, it only buys back tokens at a rate roughly 3× higher. Based on the past 30 days of buyback data for both protocols, this could be interpreted as PUMP being undervalued or HYPE being overvalued at current prices and buyback levels. That said, it’s important to note that PUMP’s buyback rate is not fixed and could be adjusted or discontinued at any time.
Conclusion
Whether Pump.fun will reclaim its former dominance remains uncertain and will depend on a combination of strategic, competitive, and market factors. Key among these are the platform’s ability to innovate and roll out features that match or surpass rivals, clarity and execution on its TBD airdrop allocation, and the sustainability of its aggressive token buyback strategy. Market cycles will also be decisive—momentum can return quickly in favorable conditions, but lasting leadership will require strong execution and renewed community trust.