
Unlock Data Analysis Mastery - Tips and Tricks on TokenUnlocks PRO That You May Not Know


TokenUnlocks is a valuable resource catering to both novice and advanced users. So that you can save days interpreting smart contracts and whitepapers, spend less time DYOR, and take faster actions backed with on-chain and off-chain data.
In this article, you will discover how to leverage the information TokenUnlocks Pro offers to enhance your effectiveness in the world of cryptocurrencies and stay steps ahead in the crypto game!
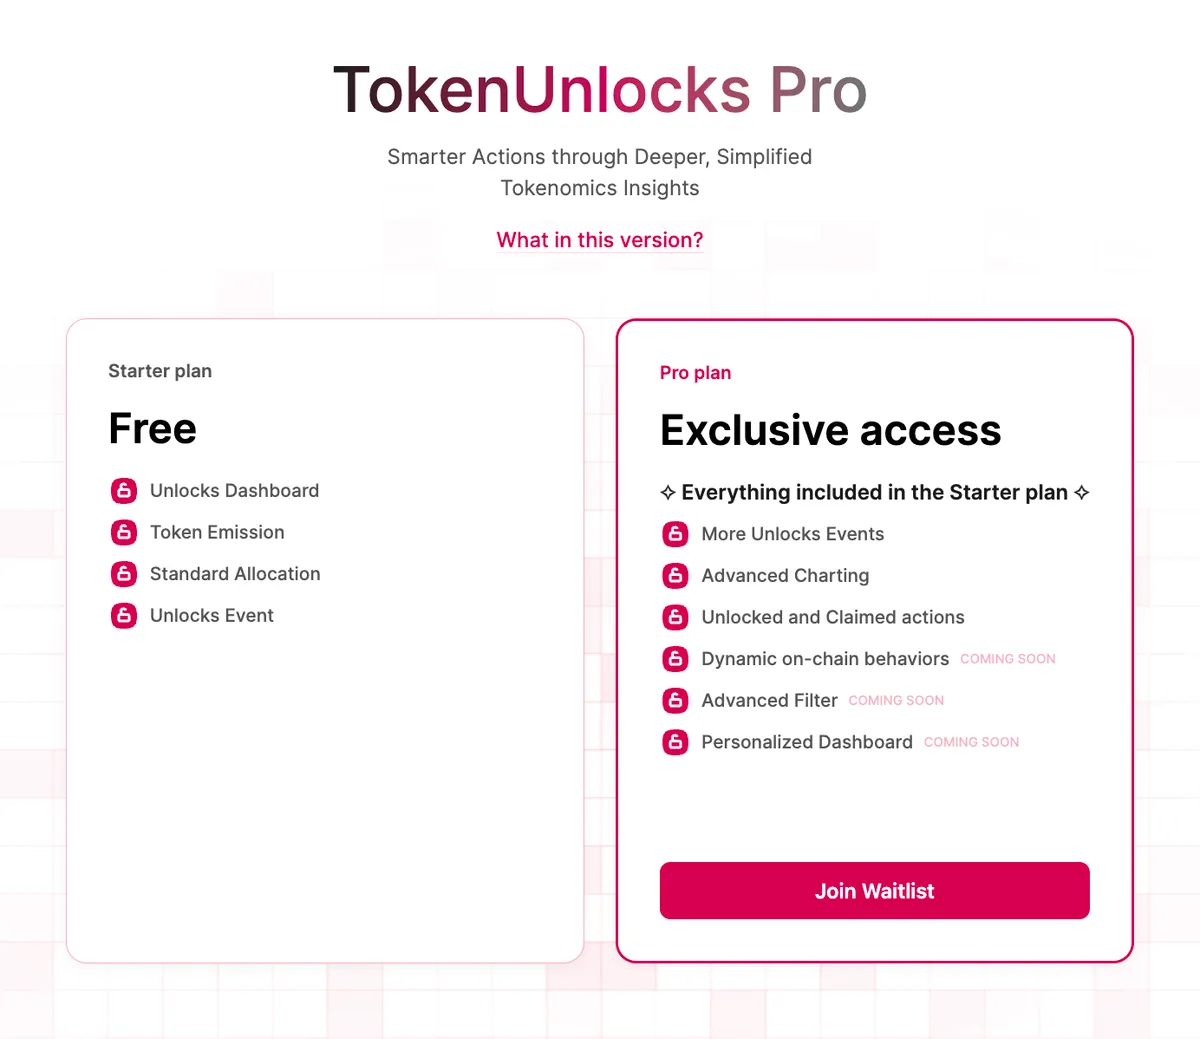
Exclusive Access
To make our tokenomics analytics even better, we're focusing on two important features: advanced charting and the claimed chart. These tools will help us analyze cryptocurrencies more effectively and understand the market better.
Advanced Charting (Price Analysis)
This feature combines price data with the vesting schedule in unaccumulative view, allowing users to see how the token price has been influenced by the vesting schedule over time. It helps users track the impact of vesting on token value.
Consider $SAND as an example. An examination of its historical data clearly reveals that every individual cliff unlock event exerts downward pressure on $SAND's price due to the increased circulating supply. Following the basic principles of supply and demand, this influx in supply consistently results in price decreases.

Nonetheless, it's important to note that not every cliff unlock event affects a token's price in a negative manner. Consider $IMX as a prime example. Despite experiencing numerous unlock events from late 2022 through March 2023, $IMX's price has continued to rise, contradicting the conventional expectation of price declines associated with unlocks.

This represents the initial phase of our analysis. Upon identifying recurring patterns associated with each event, we can initiate a more comprehensive investigation. For instance, focusing on $SAND's unlock events, which predominantly allocate tokens to Team and Advisors (marked in orange and yellow), we can utilize Etherscan to monitor the movement of funds.
Our previous Annual Report for 2022 detailed this fund tracking process.
Related: The First Ultimate TokenUnlocks Annual Research 2022

It is evident that the team wallet swiftly transferred unlocked tokens to centralized exchanges upon reception.

It's important to highlight that the price of a specific token can also be influenced by broader market conditions. For instance, if the prices of major cryptocurrencies like $BTC or $ETH experience significant declines, it often leads to a downturn across the entire market.
PRO users can now effortlessly interpret price movements during cliff unlock events with our advanced charting feature. By toggling off the cumulative view, they can precisely determine the impact of each individual cliff unlock event by overlaying its price on the vesting schedule.
Claimed Chart (Post Unlock Tracking)
Additionally, we have the capability to superimpose the vesting schedule chart with the claimed chart, which allows us to visually assess the quantity of tokens that have already been claimed and whether this quantity remains high. This analysis aids in predicting potential future selling pressure.

Now, let's examine the same example, $SAND. Following the most recent cliff unlock in August 2023, we observe that a significant portion of the unlocked tokens remains unclaimed. This presents a potential source of future selling pressure, and the uncertainty of when these tokens will be claimed adds an element of unpredictability to the price.

Now, consider $PENDLE as an example. When the claimed amount approaches the total unlock amount, indicating that almost all the tokens have been claimed, the price tends to rise. This is because the market anticipates a reduced likelihood of unexpected selling pressure in the future.
For PRO users, the claimed chart stands out as a particularly compelling feature. Our team has meticulously tracked on-chain data, providing PRO users with dependable insights. This tool empowers them to ascertain the remaining unclaimed tokens and take proactive steps like deploying hedging strategies to secure profits and shield against potential future selling pressures.
Token Emission
This feature is accessible to both non-PRO and PRO users. However, PRO users gain an advantage with access to extended timeframes for token emissions, spanning 6 months, 1 year, and from the Token Generated Event (TGE). This empowers PRO users with enhanced precision in long-term investment decisions by offering insights into longer-term inflation dynamics, such as over the course of a year.

Consider $ARB token emissions as an example. Over the next 6 months, $ARB will witness the issuance of 1.30 billion tokens, effectively doubling the current circulating supply (+101.71%). This information serves as a crucial alert for PRO users looking for long-term investments, highlighting a significant supply surge that could impact token prices. It aids PRO users in determining their investment choices wisely.
Stay tuned for more!
We're continuously enhancing our Data Analytics dashboard platform with additional features, specifically tailored for our PRO users. Expect upcoming additions like dynamic on-chain behaviors, advanced filters, personalized dashboards, and more. Your experience is about to get even better!
Be a pro before anyone else!
TL;DR
Exclusive access offers advanced charting capabilities, allowing PRO users to visualize how token prices responded to unlocked events. They can overlay the vesting schedule chart with price data by disabling the cumulative view. The claimed chart keeps PRO users informed about unclaimed tokens, helping them proactively manage hedging strategies. Integration with extended token emission timeframes enables PRO users to assess potential inflation effects on their chosen tokens.
We believe that these exclusive features enhance PRO users even more PRO!